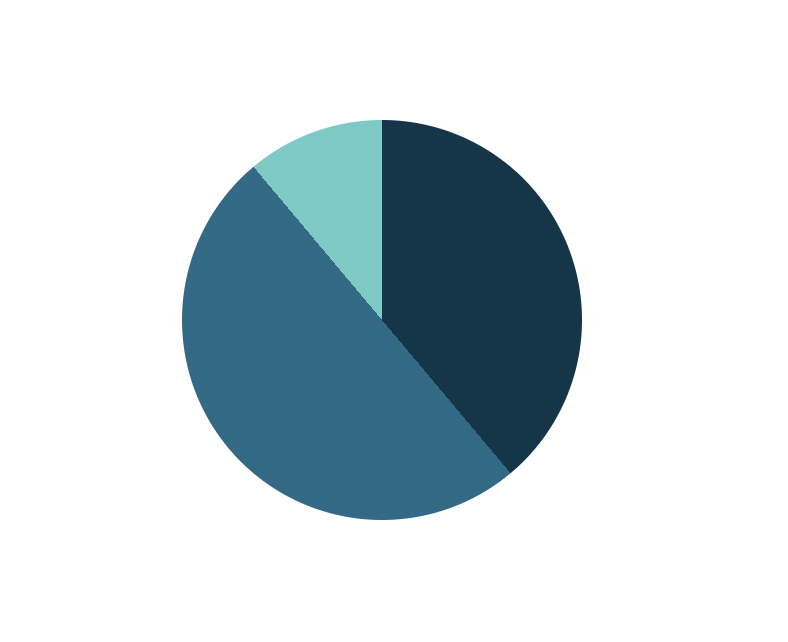
Pie chart: A bundle-friendly approach to handle charts in your web application
Unleash the power of conic gradients in CSS to transform your pie and donut charts, taking a giant leap towards optimizing bundle sizes.
What is Conic Gradients?
A conic gradient is a gradient with color transitions rotated around a center point.
Why using conic gradiants for charts?
- apexcharts and chart.js bundle size are very heavy
- conic gradients are a new feature in CSS
- Reduce bundle size from +200kb into less than 1kb
- Improve the performance
- Improve the user experience
- Create charts with less code
What are the drawbacks of using conic gradiants for charts?
- Limited documentation
Basic usage as pie chart
<!doctype html>
<html>
  <head>
    <style>
      #pie-chart {
        height: 200px;
        width: 200px;
        background-color: red; /* For browsers that do not support gradients */
        background-image: conic-gradient(#04364a 0deg, #04364a 140deg, #176b87 140deg, #176b87 320deg, #64ccc5 320deg);
        border-radius: 50%;
      }
    </style>
  </head>
  <body>
    <div id="pie-chart"></div>
  </body>
</html>
output:
Dynamic usage as pie chart
The dynamic values that will be passed
| Attibute | type | Description |
|---|---|---|
| name | string | Tag for the groub |
| value | number | Value of your data |
| color | Color | Color of the groub |
const value = [
  {
    name: "Paid bills",
    value: 10,
    color: "#6366f1",
  },
  {
    name: "Unpaid bills",
    value: 5,
    color: "#eef2ff",
  },
];
The functoin that is used to generate conic gradiant string from the values we prvodied
interface DataProps {
  name: string;
  value: number;
  color: string;
  count?: number;
  startValue?: number;
  endValue?: number;
  startPercent?: number;
  endPercent?: number;
  startDegrees?: number;
  endDegrees?: number;
}

const conicGradientValue = data
  .reduce((items: DataProps[], item, index, array) => {
    const count = item.count || 0;
    const startValue = array[index - 1]?.count ? array[index - 1].count : 0;
    const endValue = count + item.value;

    const startPercent = convertToPercent(startValue!);
    const endPercent = convertToPercent(endValue);

    const startDegrees = convertToDegrees(startPercent);
    const endDegrees = convertToDegrees(endPercent);

    items.push({
      ...item,
      count,
      startValue,
      endValue,
      startPercent,
      endPercent,
      startDegrees,
      endDegrees,
    });

    return items;
  }, [])
  .map((chart: any) => {
    const { color, startDegrees, endDegrees } = chart;
    return `${color} ${startDegrees}deg ${endDegrees}deg`;
  })
  .join();
The svelte component and how the conicGradientValue get injected into the svelte component
<div class="relative flex grow flex-col p-10">
  <svg viewBox="0 0 100 100" class="h-full w-full rounded-full">
    <foreignObject x="0" y="0" width="100" height="100" clip-path="url(#hole)">
      <div class="h-full w-full" style="background: conic-gradient({conicGradientValue});"></div>
    </foreignObject>
  </svg>
</div>
Now you can pass what ever data you want with this dynamic approach
Series: Performant charts in web applications
Episodes: (1/2)
- Pie chart: A bundle-friendly approach to handle charts in your web application
- Donut chart: A bundle-friendly approach to handle charts in your web application